Monday, May 16, 2016

Class Activity (week #10)

This week concepts of phase difference, phasors, impedance, and admittance are taught.


Figure 1: Phase Difference between two waves

Φ = (2π) (∆t / T)

Figure 2: Schematic of Phase Difference of two Vectors


Figure 3: Relationship between Cartesian and Polar Coordinate Systems

Figure 4: Reciprocal Operation of two Voltage in Phasor Form

Figure 5: Time-Domain and Phasor-Domain Representation

Conversion of  V(t) = Vm sin(ωt + Φ) to V(t) = Vm cos (ωt + Φ - 90°) 


Figure 6: Conversion of a Voltage in Time Domain to Voltage in Phasor Domain
In phasor representation, just magnitude and phase difference of a voltage or current will represent.

Figure 7: Conversion of a Complex Number to Phasor Form

Figure 8: Conversion of Sum of Two voltage to Phasor Form

Rectangle form is easier when sum and subtraction of two or more voltage or current in time domain

are done. Phasor form is easier when multiplication and division of two or more voltage or current in

time domain are done. Phasor representation is useful when two voltages or currents have the same

frequency.

Figure 9: Impedance and Admittance

R = R     ,      XL = j(ωL)    ,    Xc = (1/ jωc) = -j / (ωc) 


Figure 10: Series Circuit Analysis with Phasors


Tuesday, May 10, 2016

Series RLC Circuit Step Response & RLC Circuit Response

       Series RLC Circuit Step Response

      The measured response of the series RLC second order circuit is compared with expectations

based on the damping ratio and natural frequency of the circuit.

 Vout(t) = Vc(t) = (1/C) ∫ i(t)*dt ,  Vin = Ri + VL + Vc , Vin(t) = Ri + L (di/dt) + Vc

R(di/dt) + L d[(di/dt)]/dt + dVc/dt = 0 , d2i/dt2 + (R/L)* di/dt + (1/LC)*i = 0

i(t) = A*e^(St) , S^2 + (R/L)*S + /LC) = 0 ,  α = R/2L , ω0 = 1/ (LC)^(1/2)

Figure 1: A series RLC Circuit
 A 2v square step input voltage is applied to the series RLC circuit. Oscilloscope channel one is

connected to the input of the circuit, and its second channel is also connected to the output.

Figure 2: A real Series RLC circuit

       This circuit is an under-damped because α ˂ ω0. Resistance of resistor 0.9 Ω and capacitance 

of capacitor 4.26 μF are measured by a DMM. So damping factor α = 450000 (rad/s) , undamped 

natural frequency ω0 = 484501.6 (rad/s) , ωd (Theory) = 179560.0 (rad/s)


Figure 3: An Input-Output Graph of Series RLC circuit

According to the above graph, period of first under-damped output is 4 mm, also scale is 

1 ms = 100 mm. So (2π/ω) = (4 mm)*(1 ms/100 mm) = 0.04 ms  ωd (Measure) = 157000 (rad/s) ,

 f = 25000 Hz

Percent Error of damped natural frequency =  [(179560 - 157000)/(179560)]*100 = 12.6%


RLC Circuit Response

       The measured response of a RLC second order circuit is compared with expectations

based on the damping ratio and natural frequency of the circuit. This circuit is an under-damped because α ˂ ω0.


Figure 1: A RLC Second-Order Circuit
 A 2v square step input voltage is applied to the RLC circuit. Oscilloscope channel one is

connected to the output of the circuit, and its second channel is also connected to the input.

When input voltage is in its maximum (2v), capacitor will charge. When input voltage is equal zero, 

capacitor will parallel with L and R2. Of course, time constant of the capacitor is 

47*(8.13 μF ) = 382 μs , so the square input period should be equal or more than capacitor time

 constant. Internal resistance of inductor is measured 1.9 ohms by a DMM that is near to the R2.

  Ri + VL + Vc = 0 ,  Ri + L (di/dt) + Vc = 0

R(di/dt) + L d[(di/dt)]/dt + dVc/dt = 0 , d2i/dt2 + (R/L)* di/dt + (1/LC)*i = 0


i(t) = A*e^(St) , S^2 + (R/L)*S + /LC) = 0 ,  α = R/2L , ω0 = 1/ (LC)^(1/2)

ω0 = [8.13E(-9)]^(-1/2) = 11090.6 (rad/s) ,  ωd (Theory) = 11076.95 (rad/s) , f = 1763.8 Hz 


Figure 2: A RLC Circuit with an Input Frequency equal 400 Hz
According to the above graph, period of the under-damped output is 40 mm, also scale is 

1ms = 60 mm. So (2π/ω) = (40 mm)*(1 ms/60 mm) = (2/3) ms ωd (Measure) = 9420 (rad/s) ,

 f = 1500 Hz. Vout(t) = R2*i(t).


Percent Error of damped natural frequency =  [(11076.95 - 9420)/(11076.95)]*100 = 14.96%


Figure 3: A Real RLC Circuit


Sunday, May 1, 2016

Class Activity (Week 8)

     This week an integrator op-amp was ..... The output of an integrator op-amp is proportional to the

integral of its input signal.  Vout = (-1/RC) Vin dt

Figure 1: An Integrator Op-amp Circuit

Figure 2: Input and Output Waveform of an Integrator Op-amp

The output of a differentiator op-amp circuit is proportional to the rate of change of its input signal.

Vout = - RC (dVin / dt)


Figure 3: An Differentiator Op-amp Circuit 

Figure 4: A Schematic of an Integrator and Differentiator Op-amp


Figure 5: Input and Output Wave Forms Of Op-amps


Figure 6: Input and Output of an Differetiator Op-amp

Also unit step, unit impulse, and unit ramp function is verified.

Figure 7: The Current of a Capacitor 

U(t) = 0 , t < 0. U(t) = 1 , t > 0. U(t) is undefined at t = 0.

The unit impulse function is derivative of the unit step function δ(t) .

δ(t) = 0 , t < 0 and t > 0. δ(t) is undefined at t = 0. 

R(t) = 0 , t < 0. R(t) = t, t  0.  

U(t) = dr(t) / dt , δ(t) = du(t) / dt


Figure 8: Response of a Capacitor Voltage and Capacitor Current to a Unit Step function


Inverting Differentiator

     The output of an inverting differentiator is derivative of its input. A sinusoidal input voltage is

connected to the op-amp with three different frequencies. Power supplies voltage of op-amp are ± 5v.


Figure 1: An Inverting Differentiator Op-amp

i) f = 1 KHz , amplitude = 200 mv , and offset = 0v

According to Volt/div of oscilloscope (measured voltage), Vin = 200 mv and Vout = 1000.25 mv

Vin = Asin(ωt) , Vout = Aω cos(ωt) , ω = 2πf  , Vout = -RC dVin / dt , Vout = -(RCAω)*cos(ωt)

If R = 1KΩ and C = 1μF so RC = 10E(-3). Vout = -(0.4π)*cos(ωt) , Vout = -1.257 *cos(ωt).

Output amplitude = -1257 mv.

percent error of output voltage = [(expected voltage - measured voltage) / expected voltage]*100%

percent error = [(1257 - 1000.25) / 1257]*100% = 22.43%


Figure 2: A Sinusoidal Input voltage of 1 KHz

ii) f = 2 KHz , amplitude = 200 mv , and offset = 0v

According to Volt/div of oscilloscope (measured voltage) , Vin = 200 mv and Vout = 2500 mv

Vin = Asin(ωt) , Vout = Aω cos(ωt) , ω = 2πf  , Vout = -RC dVin / dt , Vout = -(RCAω)*cos(ωt)

If R = 1KΩ and C = 1μF so RC = 10E(-3). Vout = -(0.8π)*cos(ωt) , Vout = -2.513 *cos(ωt).

Output amplitude = -2513 mv.

percent error of output voltage = [expected voltage - measured voltage| / expected voltage]*100%

percent error = [(2513 - 2500) / 2513]*100% = 0.52%


Figure 3: A Sinusoidal Input voltage of 2 KHz


iii) f = 500 Hz , amplitude = 200 mv , and offset = 0v

According to voltage div of oscilloscope (measured voltage), Vin = 200 mv and Vout = 500 mv

Vin = Asin(ωt) , Vout = Aω cos(ωt) , ω = 2πf  , Vout = -RC dVin / dt , Vout = -(RCAω)*cos(ωt)

If R = 1KΩ and C = 1μF so RC = 10E(-3). Vout = -(0.2π)*cos(ωt) , Vout = -0.6283 *cos(ωt).

Output amplitude = -628.3 mv.

percent error of output voltage = [expected voltage - measured voltage| / expected voltage]*100%

percent error = [(628.3 - 500) / 628.3]*100% = 20.42%

Figure 4: A Sinusoidal Input voltage of 500 Hz

According to the percent errors are calculated for three different frequencies, when f = 2 KHz percent

error is less than others low frequencies. In other words, percent error of output voltage decrease 

when frequencies increase.

Frequency (Hz)
Input Voltage (mv)
Expected Output Voltage (mv)
Measured Output Voltage (mv)
Percent Error%
500
200
500
628.3
20.42
1000
200
1257
1000.25
22.43
2000
200
2513
2500
0.52


Figure 5: A Schematic of an Inverting Differentiator Op-amp

When input voltage is 1 volt, the inverting differentiator op-amp will go to saturation state.

Vin = Asin(ωt) , Vout = Aω cos(ωt) , ω = 2πf  , Vout = -RC dVin / dt , Vout = -(RCAω)*cos(ωt)

If R = 1KΩ and C = 1μF so RC = 10E(-3). 

If f = 1 KHz. Vout = -(2π)*cos(ωt) , Vout = - 6.28 *cos(ωt).

Amplitude of output voltage is equal - 6.28 v  that is bigger than power supply voltage (± 5v).


Figure 6: An Inverting Differentiator Op-amp in Saturation Situation


Thursday, April 21, 2016

Class Activity (week 7)

Charging and Discharging a Capacitor

Charging and discharging of a capacitor. Voltage in a capacitor is 90 degree lag of its current.

I = C dV(t)/dt  or V(t) = ∫I*dt + V(0).

Figure 1: Relation between The Current and Voltage of a Capacitor

Figure 2: Sinusoidal and Triangular wave input Voltage of a  Capacitor and its Current
According to the figure 2, current of a capacitor is derivative of its voltage.

Figure 3: A series-parallel circuit

When a voltage source at t = 0 connects to a empty capacitor, capacitor will act as a short circuit

(wire). Also, a completely charged capacitor acts as a open circuit.


Figure 4: Mathematical Relation of  Discharging a Capacitor

Figure 5: Schematic of Voltage an Ideal Capacitor

An Ideal capacitor keeps its voltage for a long time, but an ideal capacitor lose its voltage gradually.

Thus, an ideal capacitor is modeled similar to a capacitor parallel with a resistor. When resistance of

the resistor is equal with infinity, the capacitor is an ideal capacitor.


Figure 6: Schematic of Charging and Discharging a Capacitor

Voltage-Current Inductor Relations

         A nonideal inductor has a significant resistance, as shown in Fig. 1 because a inductor is

made of a conducting material such as copper, which has some resistance. This resistance is called 

the winding resistance (Rw), and it appears in series with the inductance of the inductor. Winding 

resistance is usually very small. A nonideal inductor also has a winding capacitance due to the

capacitive coupling (Cw) between the conducting coils. A capacitive coupling is very small and can 

be ignored in most cases, except at high frequencies. 
Figure 1: A Schematic of a non Ideal Inductor


Figure 1: Equivalent of Series- parallel Inductors


Inductor voltage difference is proportional with derivative of its current. VL(t) = L di(t)/dt ,


VL(t) = Vmax * e^(-Rt/L) , Time Constant = L/R

A inductor acts the same open circuit at t = 0s, and also it acts the same short circuit at t = ∞.


Passive RC Circuit Natural response & Inductor Voltage-Current Relations

     In this lab time constant of a capacitor is determined. R2 = 2.2 KΩ is parallel with C = 22 μF and

R1 = 1 KΩ is series with this two elements. Also, a 5V square voltage with a 1 KHz frequency is

connected to the circuit.

Figure 1: Calculation of Time Constant 

Figure 2: Calculation of a Real Time Constant
Figure 3: A Discharge Graph of a Capacitor

After 1 time constant, voltage a capacitor became Vmax/e = 0.37*V(max). According to the y-axis

in the above graph, 1 volt is equal with 27 mm so 94 mm is equal with 3.48 v = V(max).

V(max) = 3.48 v so V = 0.37*(3.48) = 1.3 v. Also, on the x-axis every 50 ms is equal with 50 mm.

1.3 Volts is correspond with 35 mm on the x-axis. This imply that time is equal with 16 ms. This

time is time constant.  Percent Error = [16 - 14.9 / 14.9 ]*100% = 7.4%


Figure 4: A Schematic of Calculation of Time Constant

Video 1: Discharging of a Capacitor
Video 2: Discharging of a capacitor 

 Inductor Voltage-Current Relations

This lab is similar to above lab. Instead of a capacitor, a inductor is used. A triangular input voltage

with frequency = 1 KHz, amplitude = 1v, and offset = 0v is connected to circuit.


Figure 1: Calculation of Time Constant

R1 = 0.983 KΩ , R2 = 2.17 KΩ , L = 1 mH , Time Constant = L/Req , Time Constant = 10^(-3)/0.677

Time Constant (Theory) = 1.48 μs     (of course, resistance of the inductor is ignored.)


Figure 3: Schematic of a Inductor circuit

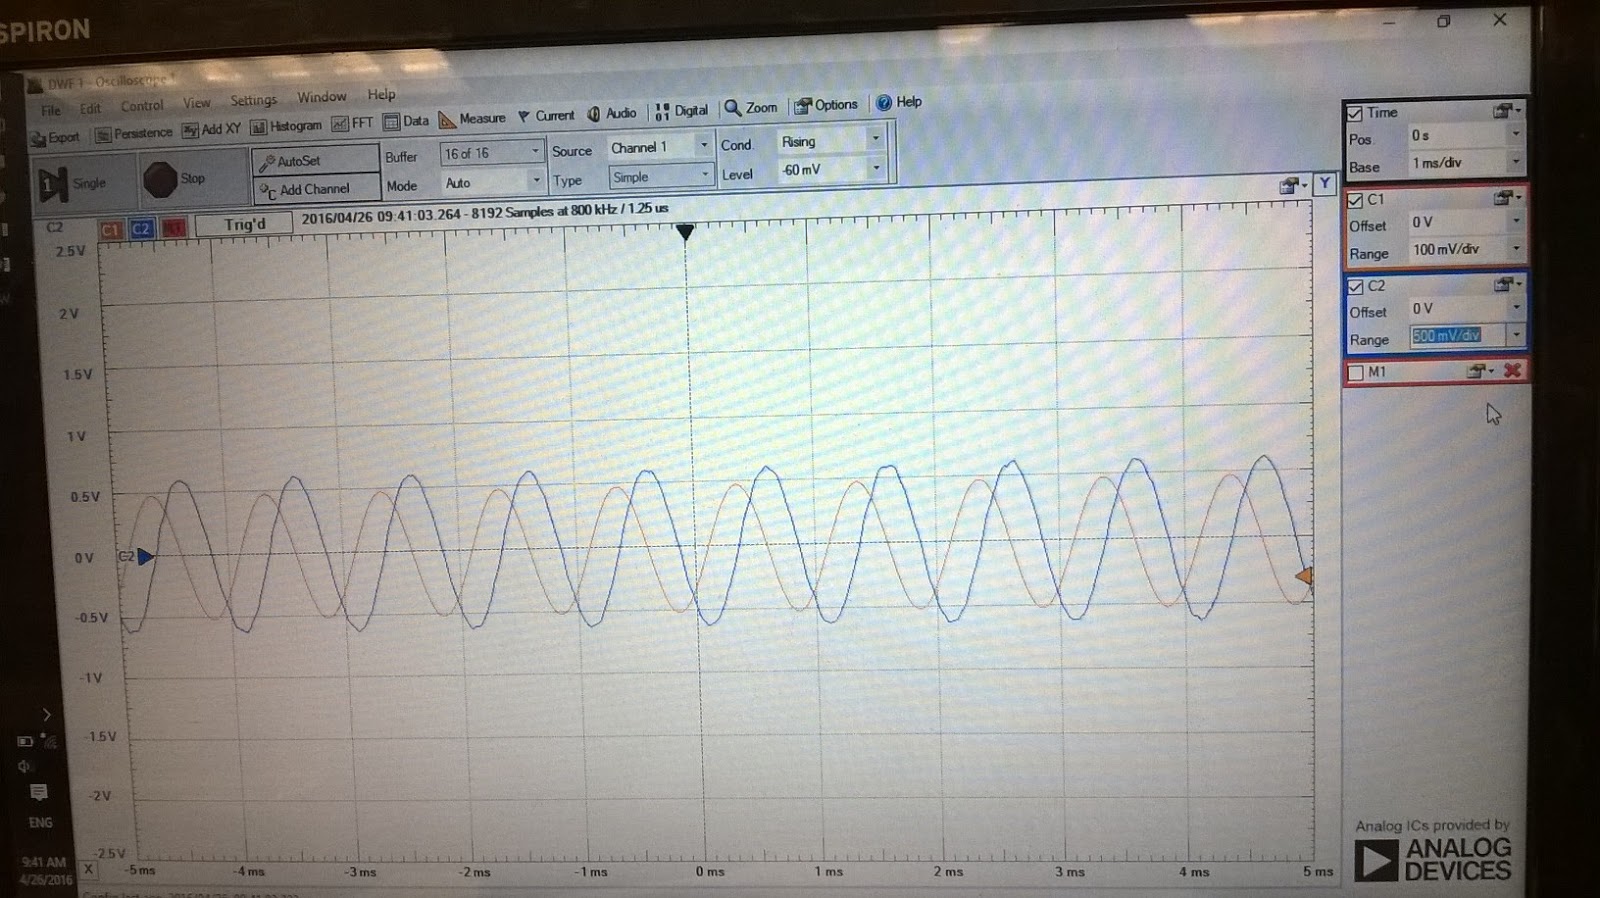
 All of quantity such as resistor (R1) voltage difference, total current, and inductor current have

triangular wave. According to, VL(t) = L dI(t)/dt , inductor voltage difference is square.

Figure 3: A Real Graph of a Part of a Real Inductor

After 1 time constant, voltage a inductor grow up to [1-(1/e)]*Vmax = 0.63*V(max). According to

the y-axis in the above graph, 2 mv is equal with 15 mm so 45 mm is equal with 6.0 mv = V(max).

V(max) = 6.0 mv so V = 0.63*(6.0) = 3.8 mv. Also, on the x-axis every 1 μs is equal with 27 mm.

3.8 mv is correspond with 40 mm on the x-axis. This imply that time is equal with 1.48 μs. This

time is time constant.  Percent Error  is zero.